Medical Image Analysis
Medical images can be categorized into different modalities, e.g. MRI, CT, Ultrasound, PET/SPECT, etc. My research in medical imaging is mainly focused on PET/SPECT and fMRI imaging of the brain to study brain diseases. Depending on different modalities, signal in brain images represents different information in the brain. For example, while MRI images can differentiate gray matter, white matter, cerebralspinal fluid, PET/SPECT images can be targeted to identify specific molecules in the brain. Therefore, the former is called structural imaging while the latter is called functional imaging. Regardless of the information presented in the image, they are both called neuroimaging and provide a way to observe what’s happening in the brain. In our work, we use neuroimaging to study brain diseases such as Parkinson’s disease.
Disease Progression Modeling

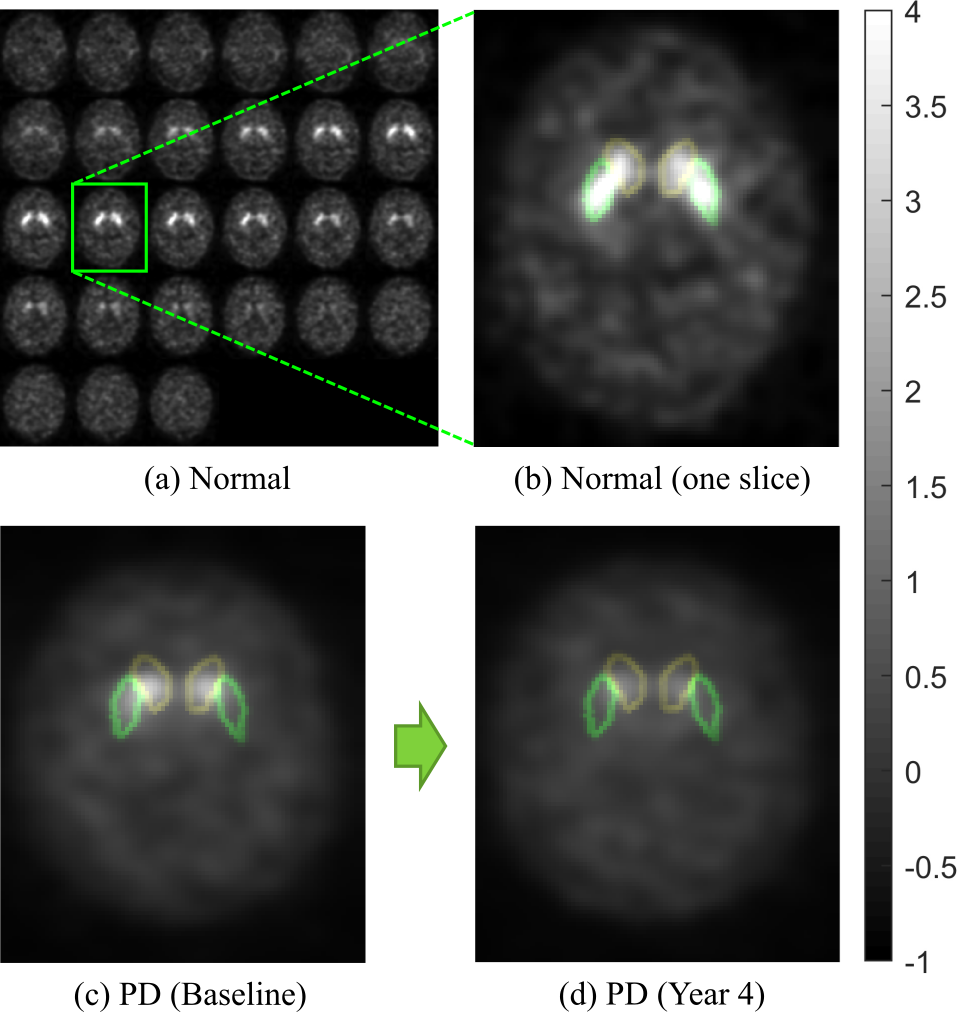
Parkinson’s disease (PD) is neurodegenerative disease caused by loss of dopaminergic neurons in the substantia nigra, accompanied by progressively worsening motor symptoms. We study PD using SPECT imaging with 123I-FP-CIT which is a radiotracer that binds to dopamine transporters hence visualizes the amount of dopaminergic neurons in the brain. The loss of dopaminergic neurons in PD is thus reflected as loss of signal in these SPECT images.
SPECT imaging with 123I-FP-CIT is also called DaTscan imaging and is approved by FDA in 2011 for diagnosing PD. DaTscan images are available in the public PPMI dataset which also includes UPDRS clinical scores, MRI images, DTI, etc. We use DaTscan images from the PPMI dataset to study the spatial progression pattern of dopaminergic neuronal loss as well as the heterogeneity of PD. The results are correlated with UPDRS clinical scores for validation …
Graph Representation Learning
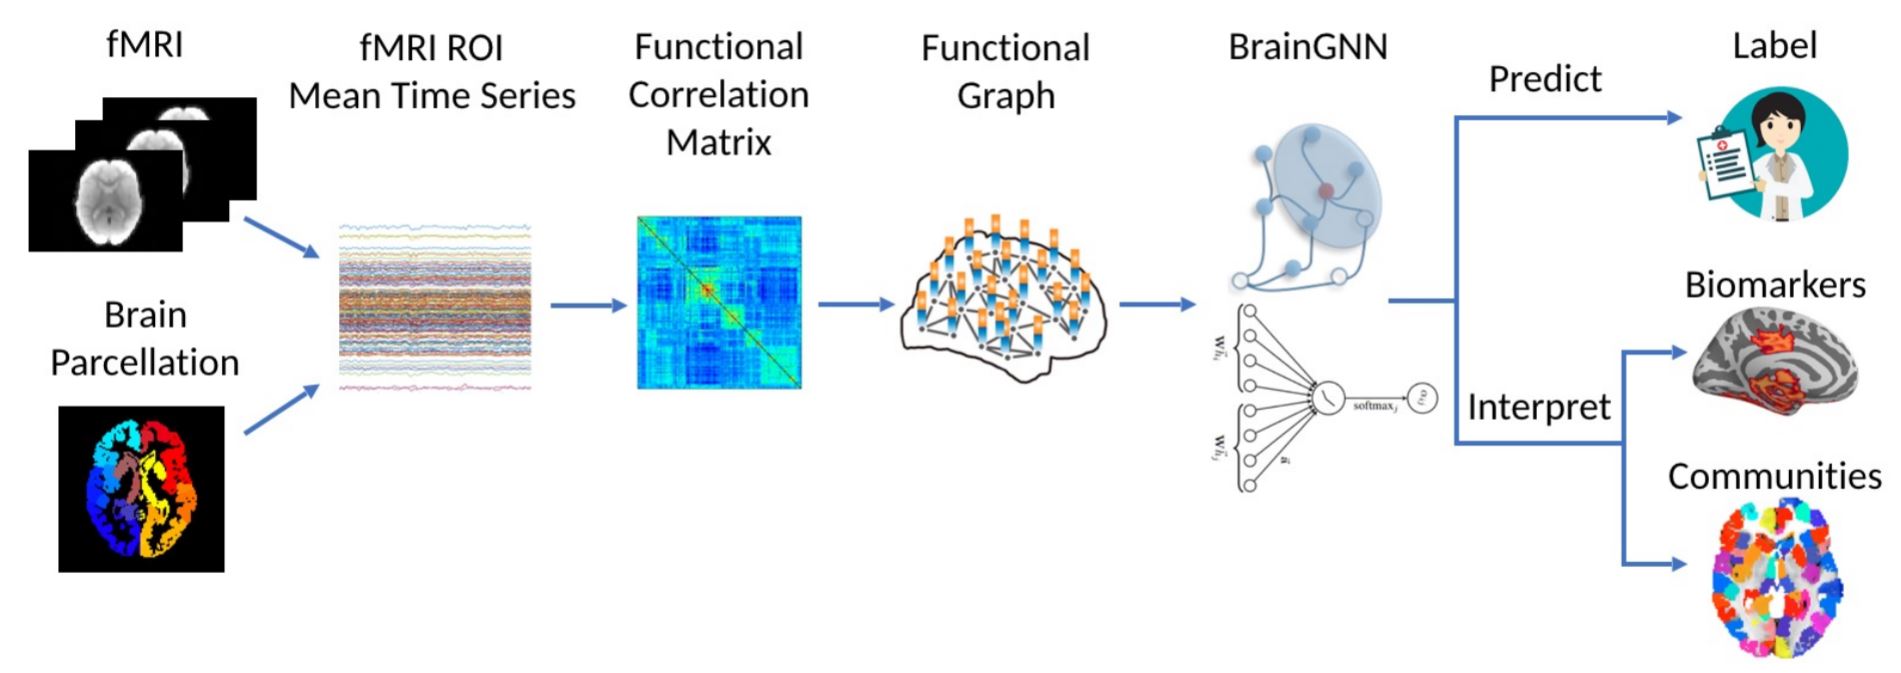
Regions in the brain are connected by neurons. Combining the regions and their connections, we can form a graph that characterize the brain structure. Hence, by analyzing the signal on the graph from fMRI (or MRI, DTI), we can study brain diseases. With the recent popularity of geometric deep learning, graph neural network is an ideal tool to study the signal on a graph. We build graphs from fMRI images of Autism and use message passing neural network (MPNN) to classify Autism from health controls …

Interpretability
Medical application requires the methodology to be interpretable. Traditional machine learning models, such as linear classifiers, are naturally interpretable. However, this is not the case with deep learning models. To apply deep learning models to medical imaging, it is imperative to find ways to interpret them. We use the Shapley value to evaluate the importance score of each feature under deep learning models. Shapley value explanation comes from game theory …
Hyperspectral Image Analysis
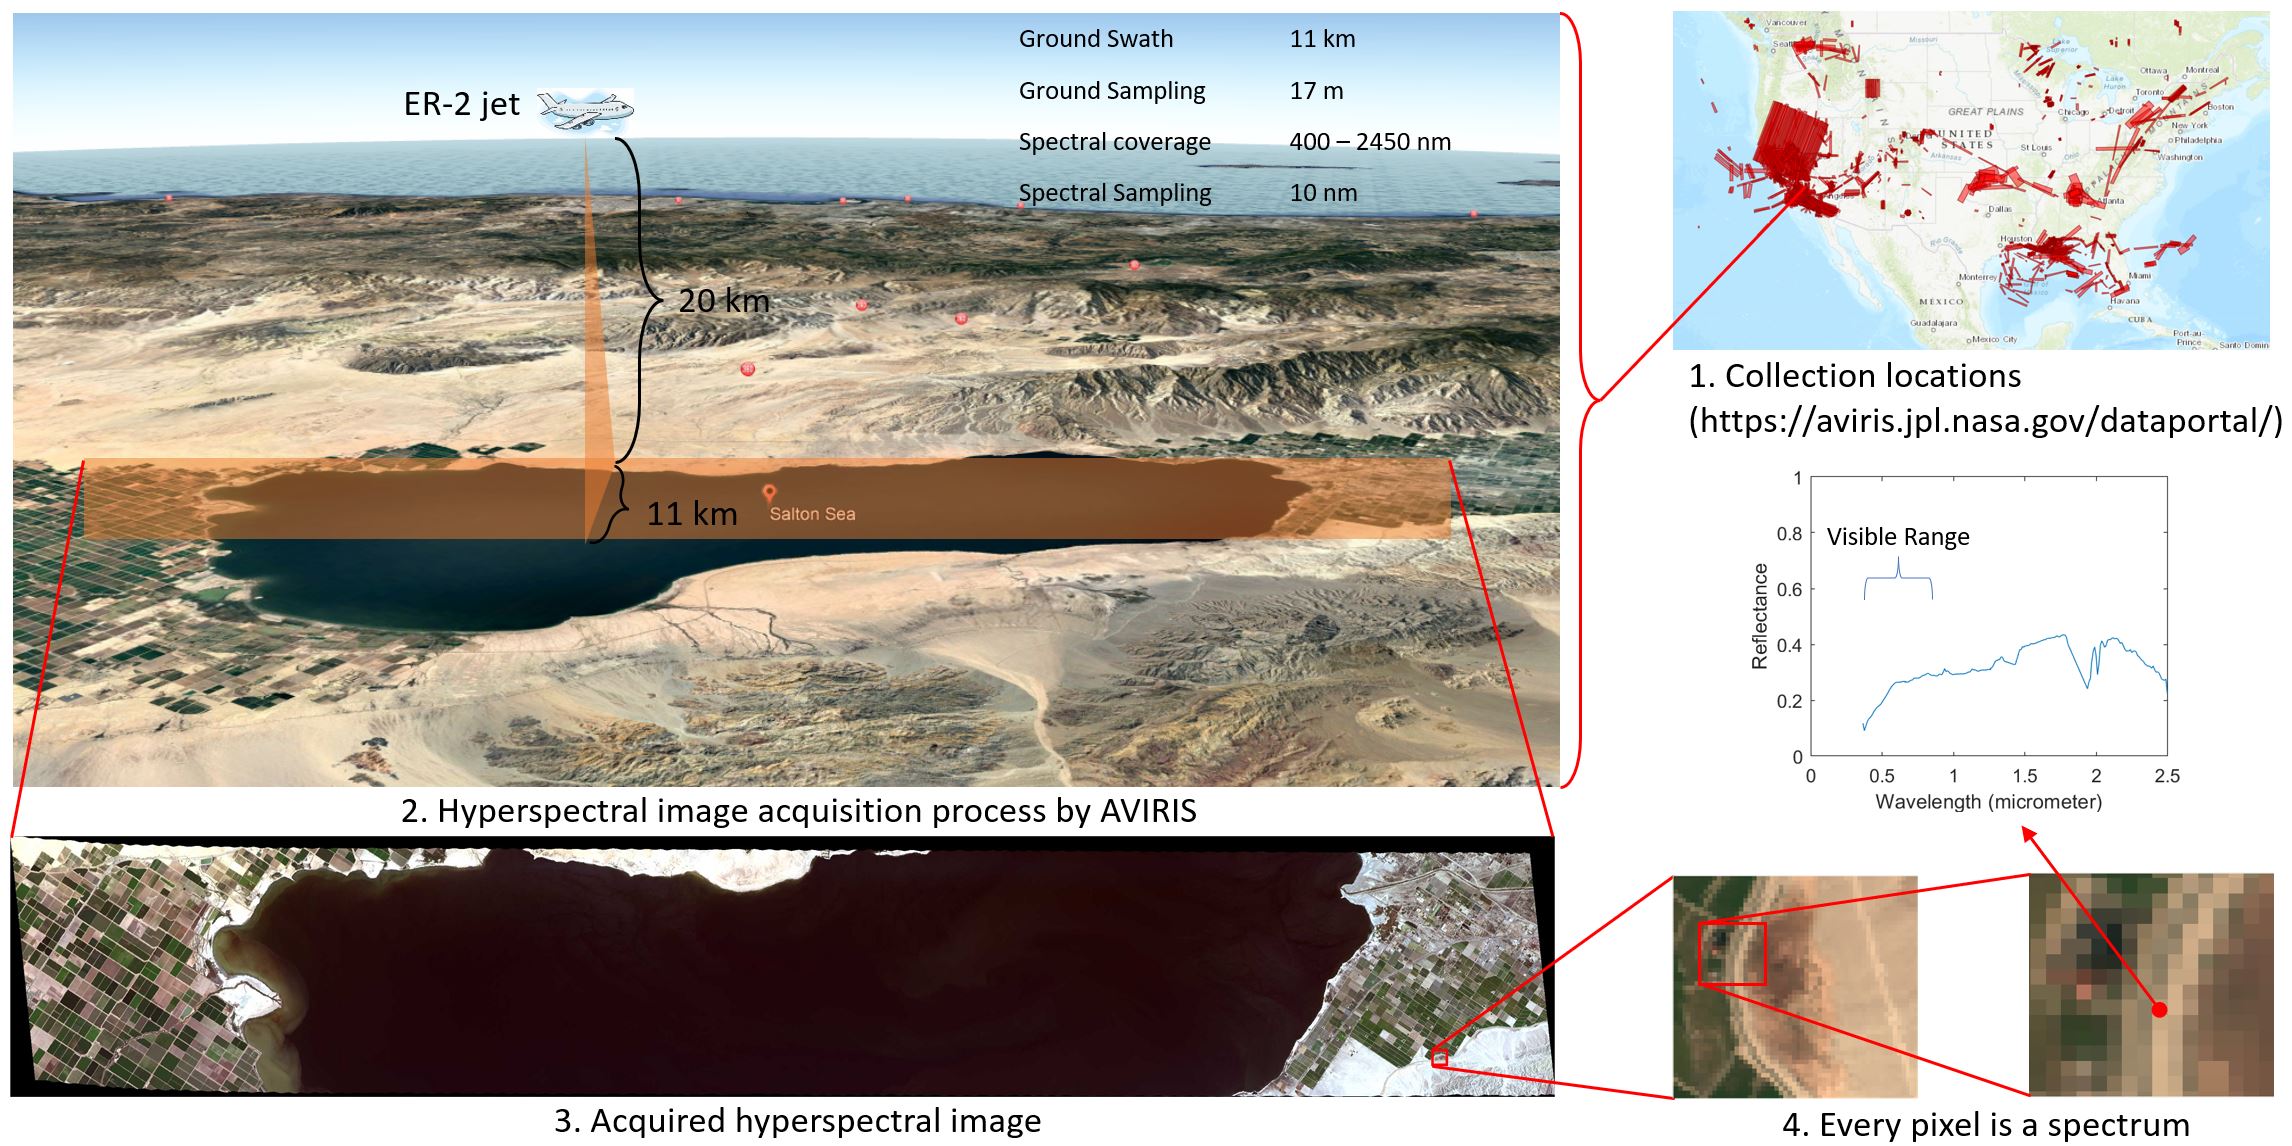
Unlike color images that have only 3 bands covering the visible range (470 nm – 860 nm), remote sensing images often provide additional spectral information by also covering the reflectance in the near-infrared (750 nm – 1000 nm) and short-wave infrared range (1000 nm – 2500 nm). This is because remote sensing images are usually acquired from a satellite or an aircraft to monitor the surface of the earth. The extra spectral bands offer additional information to discriminate different materials on the earth. The resulting multi-band image is called multispectral image when we have tens of bands, or hyperspectral image when the number of bands approaches a hundred.

Spectral Unmixing
![]()
One application of hyperspectral images is land cover mapping. Land cover information refers to the spatial composition of man-made materials (e.g. asphalt, roof) and green vegetation (e.g. trees, grass) of a particular area, usually an urban area. This information is useful because urban environment is impacted by the spatial distribution of these materials, which in turn impacts the resident health and even global climate.
Land cover mapping can be achieved by directly classifying the pixels (spectra) in hyperspectral images. However, this requires the hyperspectral image to be collected from an aircraft flying at a low altitude, which is an expensive process. A promising future is to use an orbital spectrometer (onboard a satellite) to collect hyperspectral images continuously. Then, however, the spatial resolution of the collected hyperspectral image will not be promising, i.e. a pixel may corresponds to several meters’ area (e.g. 16 m or 30 m diameter) on the earth. In this case, we need some kind of soft-classification to find the proportion of different materials in a pixel. This problem is called the spectral unmixing problem …
Registration and Fusion
Another problem is that a satellite often provides a multispectral image (or a panchromatic image) in addition to the hyperspectral image. A multispectral image has higher spatial resolution than a hyperspectral image but lower spectral resolution. Fusing these two types of images can lead to a both spatially and spectrally high-resolution image. How to spatially calibrate these two images for fusion (i.e. image registration) and how to combine them to produce an image that has both the advantages is another research topic …


